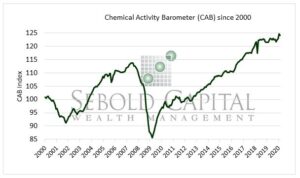
 The Chemical Activity Barometer (CAB) is a composite index, which is comprised of indicators drawn from a range of chemicals and sectors, including chlorine, alkalis, pigments, plastic resins and other selected basic industrial chemicals. It has been shown to provide a lead of 2 to 14 months, with an average lead of 8 months at cycle peaks as determined by the National Bureau of Economic Research.
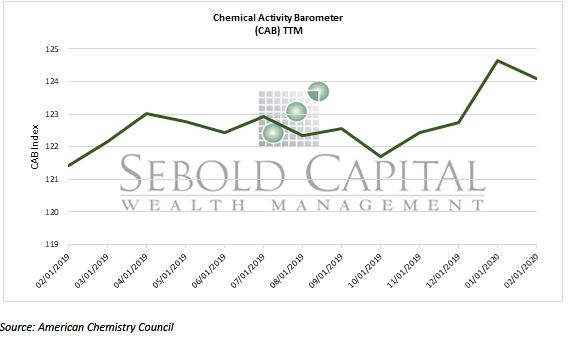
The February CAB of 124.08 is at a -0.45% decrease from last month’s adjusted reading but is up 2.2% from last year. The 3-month moving average has a positive 0.4% change this month and was also up 2% from last year.
All four categories that make up the CAB—production, equities, prices, and others—all increased this month. This signals slow growth to come in global manufacturing and consumer spending. In addition, trends in construction-related resins, pigments, and related performance chemistry generally improved and this suggests further gains in housing. The Positive CAB amount signals future positive increases, despite the small dip in February.
The Coronavirus data has not yet been taken into consideration with these numbers. We will see what this future looking data looks like.
March 16, 2020