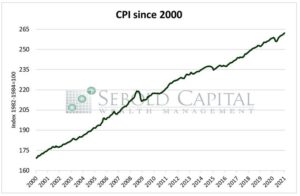
 The Consumer Price Index (CPI) tells us of any inflationary pressures in the economy. The CPI measures the average price levels of a basket of goods and services purchased by consumers. The index starts with a base time period (1982-1984, currently) and shows the overall increase since that time. As with many economic indicators, it can be volatile from month to month, with food and energy prices often leading the volatility.
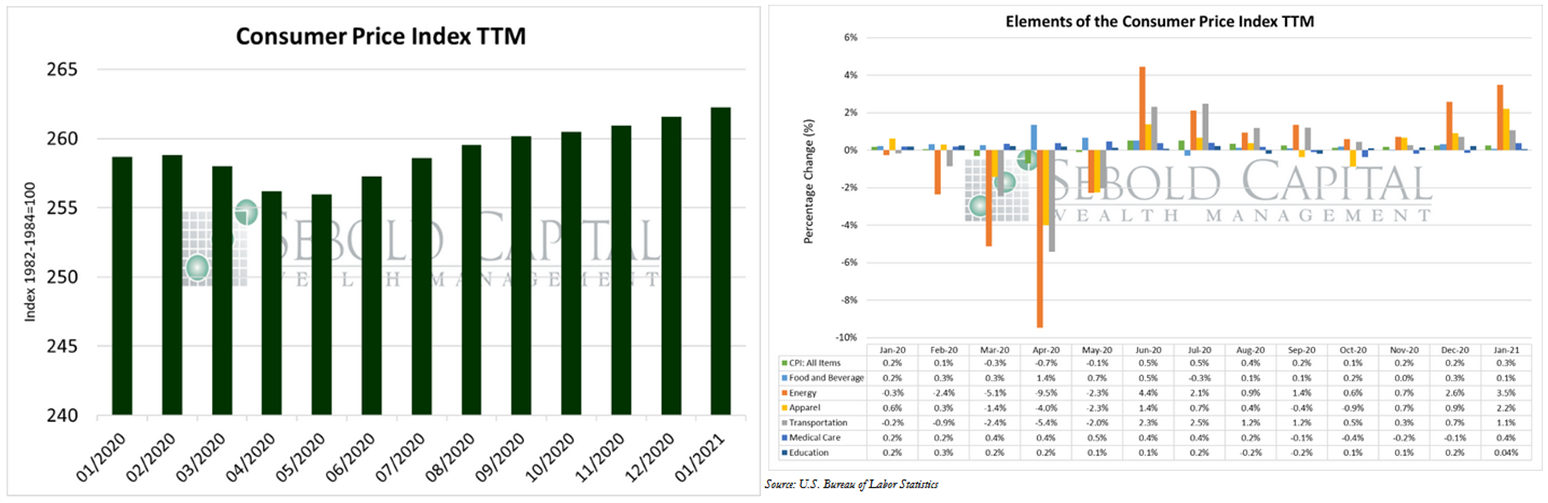
In January, the CPI increased by 0.3% to a level of 262.2. All of the components that make up the index rose in price last month. Most notably, the cost of energy surged by 3.5%, mostly due to higher gasoline prices. The indexes that measure prices for transportation and apparel also saw notable increases, with the former rising by 1.1% and the latter by 2.2%. The cost of medical care rose by 0.4% and prices for food and beverage increased by 0.1%. The price of education remained nearly unchanged, only rising by 0.04%. Core CPI, which excludes prices for food and energy—and is therefore considered to be less volatile—also remained basically unchanged, raising from 269.9 to 270.0.
Prices for consumer goods and services increased last month at the fastest rate in five months. Fuel prices, which surged by 7.4%, had the biggest impact on the index as a whole. Using the CPI as a measure, inflation has remained relatively low over the past year, with prices only increasing by 1.4%. However, the trillions of dollars in fiscal stimulus that have been pumped into the economy will likely create stronger inflationary pressure in the near future—especially since the Fed has stated that it intends to keep interest rate near zero for the next few years.
February 10, 2021