 The Consumer Price Index (CPI) shows us inflationary pressures in the economy. The CPI measures the average price levels of a basket of goods and services purchased by consumers. The index starts with a base time period (1982-1984, currently) and shows the overall increase since that time. As with many economic indicators, it can be volatile from month to month, with food and energy prices often leading the volatility.
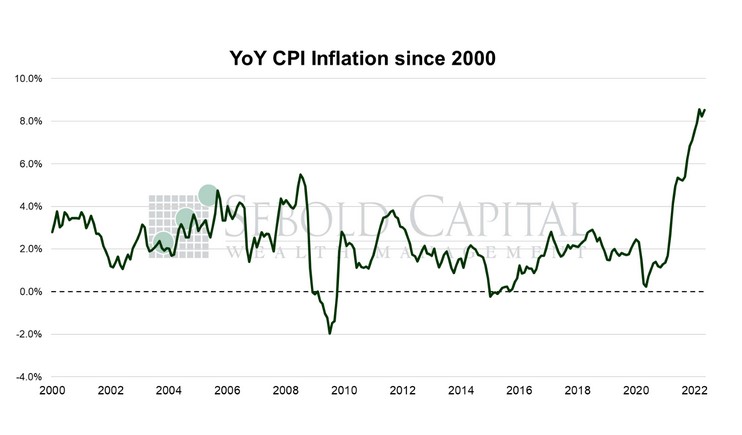
In May, the CPI soared by 1.0% to a level of 291.5, exceeding market expectations of a 0.6% advance. Year-over-year inflation rose to 8.6%, hitting yet another 40-year high. Core CPI—which excludes prices for food and energy and is therefore considered to be less volatile—rose by 0.6% to a level of 292.3, also above the consensus. On the other hand, core inflation declined last month, although merely from 6.1% to 6.0%.
Inflation decided to surprise everyone last month—or at least everyone who had not been paying attention to energy prices in recent weeks—picking up speed once again after what seemed like a peak in March and a slight reprieve in April. Unsurprisingly, last month’s increase was mainly driven by a rapid advance in energy prices, which soared 34.6% on an annual basis. Looking at energy costs a little closer, the picture looks even bleaker; gasoline prices went up 48.7% from a year earlier and fuel oil prices in general have increased by a truly eye-watering 75.9%. Transportation prices also contributed to the advance in the inflation print, rising by 2.0% in a single month and 19.3% on a year-over-year basis. A good chunk of that increase was due to used car prices, which reversed three consecutive months of declines by rising 1.8%.
Compared to those two categories, the remaining components of the CPI would barely register in most people’s radar, but they posted increases of their own that were not insignificant. For instance, owner’s equivalent rent, which is supposed to measure shelter costs, rose 0.6% from the previous month and posted an annual inflation rate of 5.1%—the highest since 1991. Shelter costs are usually regarded as an indicator of broad inflationary pressures, so an increase in these does not bode well for the inflation outlook. This puts increased pressure on the Federal Reserve to be more aggressive with monetary policy. Two more rate hikes of at least 50 basis points each were already expected this year, and a third one looks quite likely at the moment. At the time of writing, the futures market is pricing in another half-point hike in September with a 55.7% probability. That is down from the day before but only because expectations for even higher rates have increased. These expectations are being reflected on the equity and fixed income markets, which have sold off and will likely remain volatile as interest rate expectations continue to fluctuate. There is also the matter of what persistently high inflation means for economic growth. It does not have a positive impact on growth. Choppy waters ahead. 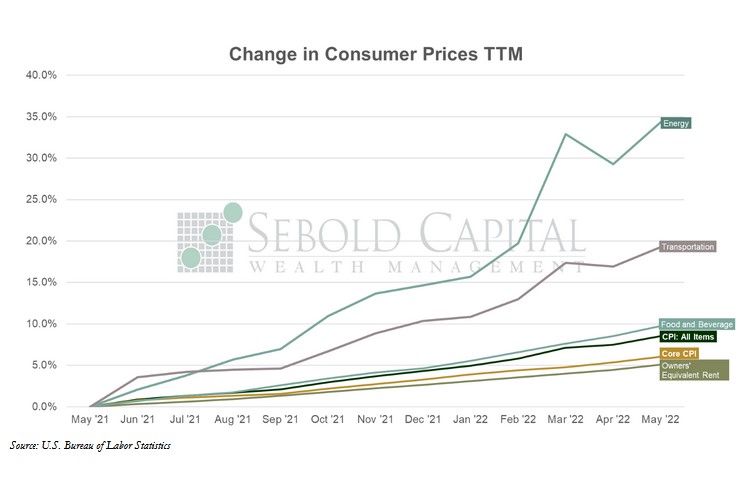
June 10, 2022