 Gross Domestic Product (GDP) is the broadest measure of economic activity within a country and measures the market value of all final goods and services produced within a country over a certain period. There are four components GDP is made up of: investment (including residential and nonresidential expenditures), consumption (including durable goods, nondurable goods, and services spending), government spending, and net exports (a country’s total exports minus its total imports).
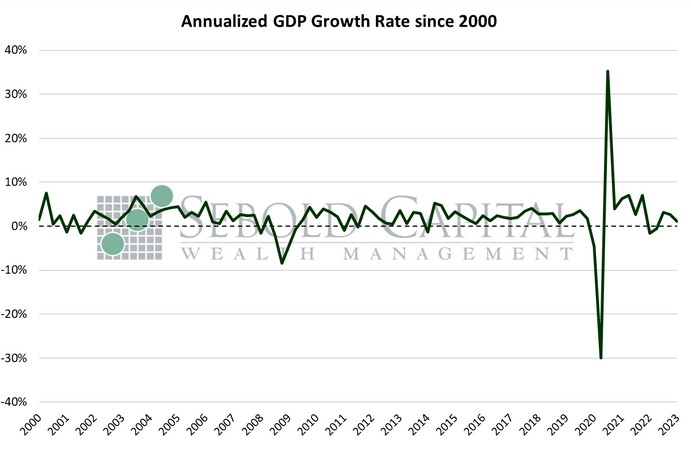
According to the Bureau of Economic Analysis’ first estimate for Q1, real GDP grew at an annual rate of 1.1%, down from 2.6% the previous quarter. The print also came in below expectations, which called for a 2% increase. Consumption, government expenditures, and net exports all had positive contributions to the headline print. However, a decline in private domestic investment ended up offsetting the increases in those categories.
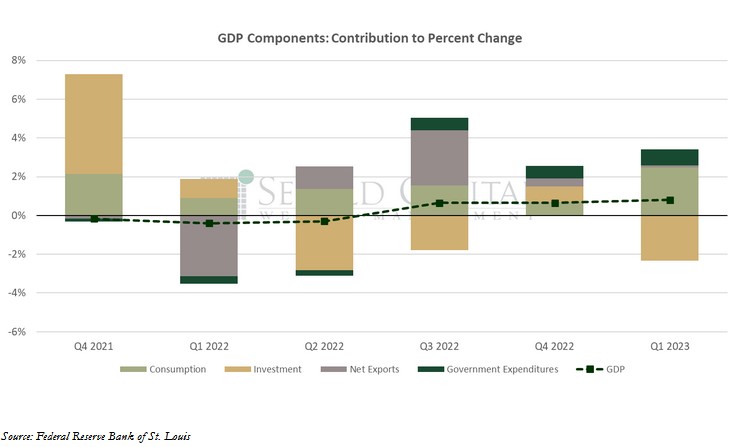
Personal consumption expenditures, which make up the largest share of GDP, increased at an annual rate of 3.7%, just below the expected 4% advance. Demand for both goods and services rose last quarter, in particular durable goods, which increased at rate of 16.9%. The overall contribution of consumer spending to GDP was 2.5%, up from 0.7% the previous quarter. Net exports increased 2.05%, although that only contributed about 0.1% to the headline number. However, private domestic investment was weak, a trend that has been present for the past few quarters. Investment declined 2.3% in Q1, mainly driven by plummeting residential investment and falling inventories. It is likely that rising borrowing costs and what some firms perceive as softening consumer demand are having an impact on capital expenditure decisions by businesses. The decline in private inventories alone subtracted 2.6% from the headline number, the single largest hit to the bottom line since the pandemic lockdowns. Government spending ended up adding 0.8% to the final number, effectively contributing over two-thirds of the final print, driven mainly by yet another large increase in nondefense federal spending. Its positive contribution must be taken with a grain of salt, as government spending crowds out consumer spending in the long run.
The GDP price index, used to adjust GDP for inflation, increased by 4%, beating the 3.5% forecast. However, it is only a minor increase from the 3.9% print in Q4. Quarterly numbers are naturally less volatile and may take longer to reflect ongoing trends in the direction of price level. PCE prices were probably the biggest surprise of this report, with the quarter-over-quarter print coming in at 4.2% when the expectation was only a 0.5% advance. Core PCE prices likewise surprised to the upside, increasing by 4.9% against a 4.1% forecast. It should be noted that this is only the first estimate, meaning revisions are likely.
April 27, 2023