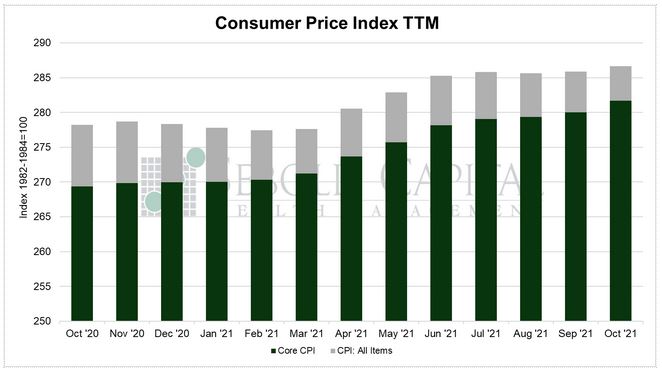
 The Consumer Price Index (CPI) shows us inflationary pressures in the economy. The CPI measures the average price levels of a basket of goods and services purchased by consumers. The index starts with a base time period (1982-1984, currently) and shows the overall increase since that time. As with many economic indicators, it can be volatile from month to month, with food and energy prices often leading the volatility.
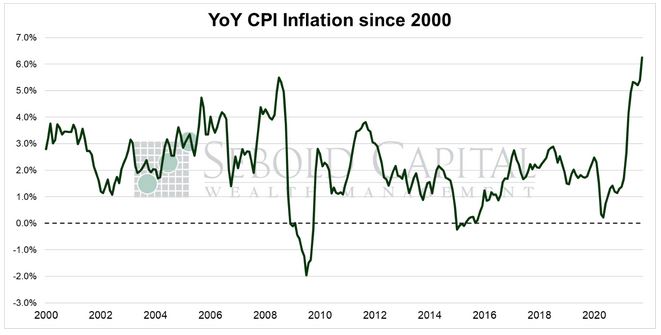
In October, the CPI rose by 0.9% to a level of 276.7, blowing past market expectations of a 0.5% advance. Year-over-year consumer price inflation surged to a 31-year high of 6.2%, way above most forecasts which hovered around 5.7%. Core CPI—which excludes prices for food and energy and is therefore considered to be less volatile—rose by 0.6% to a level of 281.7. Core inflation increased to 4.6% on a year-over-year basis, also hitting a three-decade high.
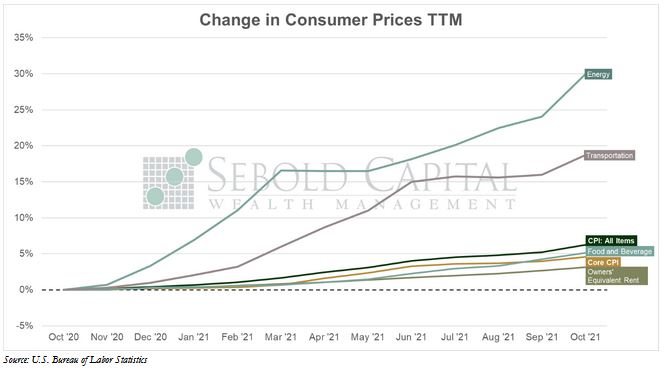
Consumer prices continued their relentless advance last month, increasing at the highest annual rate since late 1990. Energy prices spiked 4.8% from the previous month and have increased 30% since last year. Transportation costs rose by 2.4% in October and have increased at an annual rate of 18.7%. Prices for food and beverage Food and beverage advanced 0.8% and are 5.1% higher than they were last year. Owners’ equivalent rent, which is meant to represent housing costs in the index, rose by 0.4% for the month and has increased by 3.1% since last year. Other categories, such as apparel of education, posted less significant advances or remained unchanged altogether. No major category showed a decline.
Many of the factors driving the rise in consumer prices have proven to be less transitory in nature than expected, and there are plenty of signs that prices still have room to continue their upward trajectory. Owners’ equivalent rent, which is the single largest component of the CPI, still fails to capture the extent to which home prices have risen over the past several months. The S&P/Case Shiller National Home Price index indicates home prices had surged by 19.9% on a year-over-year basis (as of August, the index is released with a two-month delay); the OER index showed a 2.6% gain for the same period. It usually takes a few quarters for Owners’ Equivalent Rent to pickup changes in actual rents and home prices, so it will likely post strong advances well into next year.
Price pressures are getting broader throughout the economy, indicating that inflation will persist for a longer period than what might typically be considered transitory. Despite soaring prices and increasingly high inflation expectations (consumer expectations stood at 5.7% for the year ahead in October), consumer demand has hardly budged, as several major companies have pointed out during this earnings season. While everyone has seemingly pointed to supply-side issues as the main culprit for rising prices, the truth is that demand may actually be the driving factor. An influx of money into the economy will do wonders for demand, and M1 money stock has increased by 390% since the start of the pandemic. It’s not hard to put two and two together. When supply is weakened by a pandemic and its accompanying lockdowns, it is easily overpowered by a surge in demand. Given the current conditions, prices will likely continue to rise well into next year are unlikely to budge for the foreseeable future.
November 10, 2021