 The Consumer Price Index (CPI) shows us inflationary pressures in the economy. The CPI measures the average price levels of a basket of goods and services purchased by consumers. The index starts with a base time period (1982-1984, currently) and shows the overall increase since that time. As with many economic indicators, it can be volatile from month to month, with food and energy prices often leading the volatility.
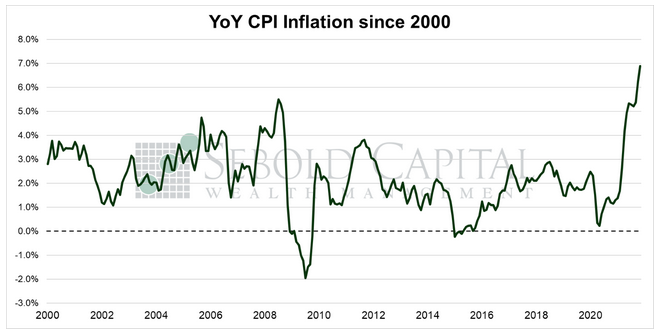
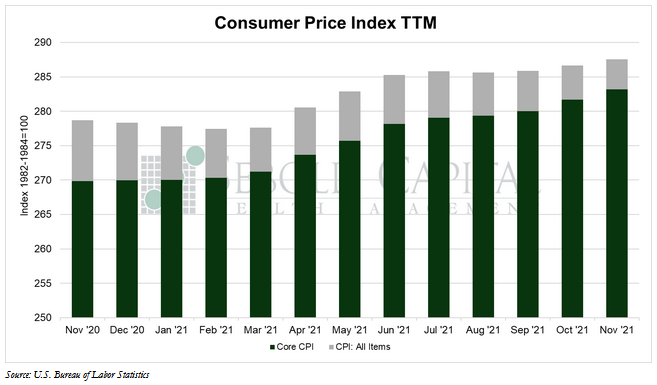
In November, the CPI rose by 0.8% to a level of 278.9, right in line with market expectations. Year-over-year consumer price inflation surged to 6.9%, its highest level in 39 years. Core CPI—which excludes prices for food and energy and is therefore considered to be less volatile—rose by 0.5% to a level of 283.2. Core inflation soared to 5.0%, the highest since late 1991.
Consumer prices continued to rise at an alarming rate in November, marking the fifth consecutive month this year in which inflation has been above 5%. Prices for energy increased by 3.5% last month and have surged by 33.5% on the year. More specifically, prices for gasoline went up by 6.1% from the previous month, and have increased by an eye-watering 58.1% annual rate. Transportation costs likewise saw a big jump last month, increasing by 2.5%. Year-over-year, they have gone up by 21.3%, with a lot of the increase being attributable to used car prices rising by 31.4% and new vehicle prices increasing by 11.1%. Other categories posted advances that, by comparison, look modest but are above historical trends nonetheless. Food and beverage prices rose by 0.7%, apparel prices increased by 1.3%, owners’ equivalent rent advanced 0.4%, and costs for medical care and education went up by 0.2% each.
At this point, anyone who chooses to utter the word “transitory” in regard to inflation must be actively ignoring the slew of data that suggests otherwise. It is getting nearly impossible to write off these CPI advances as merely the result of base effects or factors related to the economy reopening. The drivers of inflation are becoming much broader and increasingly more fundamental. For instance, recent data releases showed that nonfarm productivity declined by 5.2% in Q3, while unit labor costs surged by 9.6% over the same period. When workers are producing less but earning more (at least in nominal terms), that leads to rising prices: inflation. Likewise, the share of the CPI that is made up of these core prices have been continuously increasing throughout the year, pointing to broader price pressures. The logic behind core prices might be a tad shaky—while food and energy prices are indeed volatile, people still need to buy food and consume energy, so they very much feel those price increases—but their increasing contribution to the index means that CPI inflation cannot simply be blamed on volatile gas or meat prices.
In reaction to continued pressure on inflation, the Federal Reserve recently hinted that they may accelerate tapering and end their gargantuan asset purchase program in March of next year instead of June. We do expect them to begin the process of raising interest rates from zero after they complete their QE program. The Phillips curve appears to be back in the dialog. In the meantime, however, prices will continue to rise until the Fed takes action. Inflation is already on track to exceed 7% for the year, so consumers should continue to brace themselves for higher prices.
December 10, 2021