 The Consumer Price Index (CPI) shows us inflationary pressures in the economy. The CPI measures the average price levels of a basket of goods and services purchased by consumers. The index starts with a base time period (1982-1984, currently) and shows the overall increase since that time. As with many economic indicators, it can be volatile from month to month, with food and energy prices often leading the volatility.
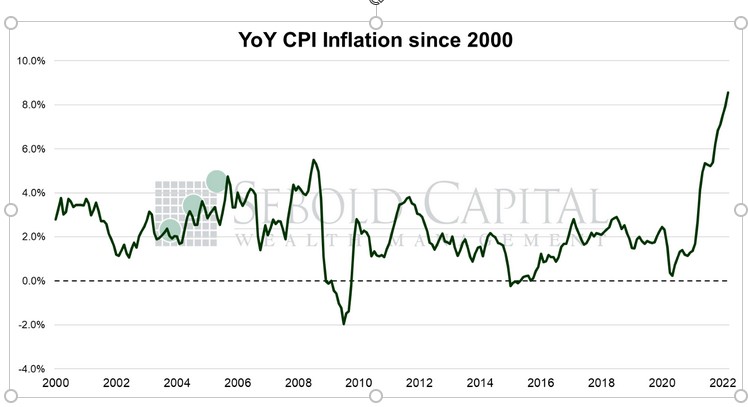
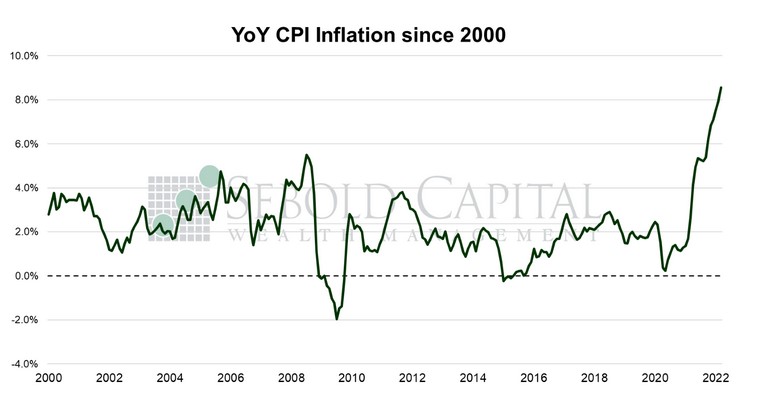
In March, the CPI soared by 1.2% to a level of 287.7, slightly exceeding market expectations of a 1.0% advance. Year-over-year inflation surged to 8.5%, its highest level since December 1981. Core CPI—which excludes prices for food and energy and is therefore considered to be less volatile—rose by 0.3% to a level of 288.8, just below market forecasts. Core inflation rose to 6.5%, its highest level since September 1982. The gap between headline and core CPI inflation was particularly pronounced last month—the largest since 2009.
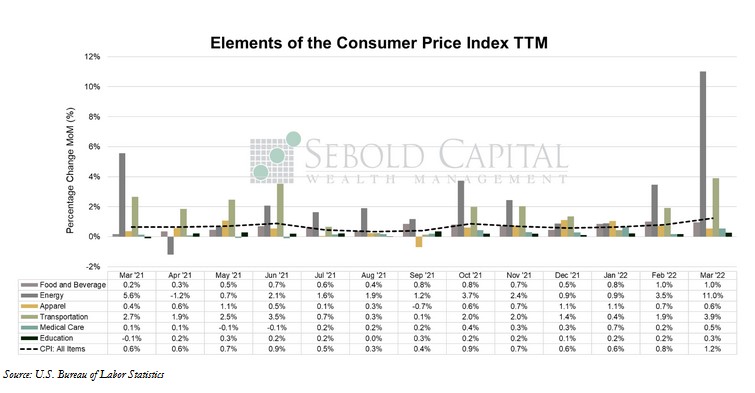
Inflation, as measured by the CPI, surged to yet another four-decade high last month, driven primarily by soaring energy and food costs. Gasoline prices alone rose by 18.3 % in a single month, while the broader category of energy advanced 11.0%. Food and beverage costs increased by 8.5%, with meat prices rising by 14.8%. Most of last month’s increase in prices is undoubtedly a result of the invasion in Ukraine. However, it is important to remember two things—supply shocks are not the same as inflation and prices had already risen considerably prior to the invasion. Prices in February were up 7.9% on an annual basis; the invasion did not begin until late February. In other words, the situation in Ukraine cannot explain the nearly parabolic increase in prices that had already occurred prior to February 24th, as some would like to pretend.
Core inflation, which strips out food and energy prices (the two categories that have been most impacted by supply shocks resulting from the Ukraine invasion), stands at 6.5%. Housing costs have gone up by 4.5%. Clothing and apparel prices have increased by 6.8%. Transportation costs have soared by 22.5%. Even food and energy had already seen substantial increases prior to the invasion; crude oil prices had already soared by nearly 100% from January 2021 to January 2022, while food prices had increased by 7.6%. That is not to say that the situation in Ukraine has had no impact on prices, or that it will not continue to have an impact. While energy prices have eased recently as a result of new lockdowns in China, they are likely to start rising again once those lockdowns are lifted. Likewise, disruptions in the supply of fertilizers and the production of certain food items will likely put pressure on food prices later this year. However, the underlying inflation problem remains present, and although the Federal Reserve has finally started taking steps to address it, we will continue to see inflationary pressures for at least the next several months.
April 12, 2022