 The Employment Situation is a report by the Bureau of Labor Statistics that gives an overview of the overall employment outlook of the US economy. The report does not include those employed in agriculture because of the seasonal nature of their work. This report obtains these numbers from 142,000 businesses and government agencies to track the new jobs added in non-farming sectors of the economy.
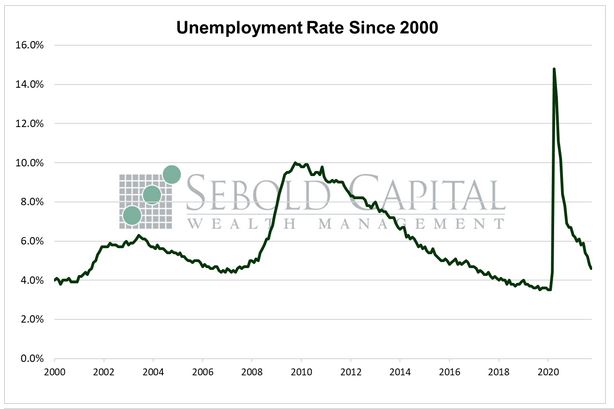
In October, U.S. employment rose by 531,000 to a level of 154.0 million, beating market expectations of 450,000. The headline unemployment rate declined by 0.2% to 4.6%, reaching its lowest point since the pandemic—although it remains above the pre-pandemic low of 3.5%. The unemployment level declined by 255,000 to 7.4 million. The average workweek decreased from 34.8 hours to 34.7. Average weekly earnings rose by $0.73 to $1,074.30, while average hourly earnings rose by $0.11 to $31.00. The labor force participation rate remained unchanged at 61.6%, compared to 63.3 right before the pandemic began.
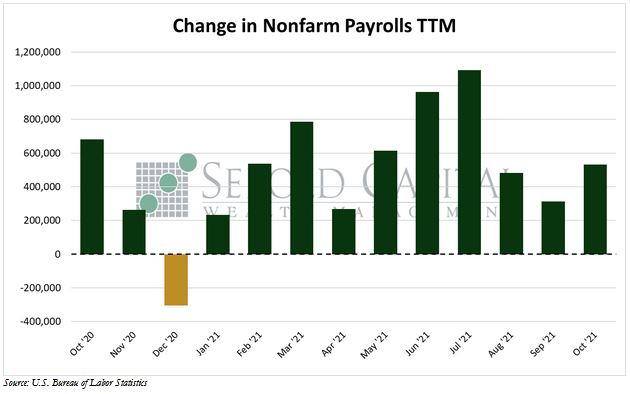
Payroll growth rebounded last month after sharply missing expectations in September. September’s data, however, saw a big upward revision from 194,000 to 312,000 jobs added. Adjusting for seasonality has become an issue for the BLS given the way in which the pandemic, and the subsequent response to it, has distorted the labor market. Payroll growth in October was driven by hiring in the leisure and hospitality, professional services, and manufacturing industries. These industries are nearing their pre-pandemic employment levels, although they remain slightly short of that, and have posted strong growth over the past few months. The economy as a whole is still about 4.7 million jobs short from pre-pandemic levels.
October was likely the first month in which the impact of ending the enhanced unemployment benefits at a nationwide level was finally observable. Previously, the states that had ended the additional payments early had seen job gains that exceeded the national average. The enhanced benefits expired in early September, but their impact on unemployment did not show up in that month’s report given that the Labor Department’s survey occurred a week after their expiration. However, the October survey was able to better capture their impact on the labor market; not coincidentally, some of the industries that saw the most notable gains last month were those in which employers cited the enhanced benefits as one of the main challenges when trying to hire.
While the expiration of the enhanced benefits ended one disincentive to work, there are several that remain in place. Many are still receiving checks from the federal government, now in the form of the fully refundable child tax credit. Food stamps have been expanded. Vaccine mandates from the federal government have been shown to slow employment growth as some continue to refuse to comply and would rather lose their jobs.
Those are merely the existing ones, but there are proposals in the works to expand these and add new ones, which would likely hinder the labor market recovery and slow down economic growth. However, the enhanced UI benefits were likely the main factor weighing on the labor market, so now that those have ended, we should see relatively stronger job growth over the next several months.
November 8, 2021