 The Employment Situation is a report by the Bureau of Labor Statistics that gives an overview of the overall employment outlook of the US economy. The report does not include those employed in agriculture because of the seasonal nature of their work. This report obtains these numbers from 142,000 businesses and government agencies to track the new jobs added in non-farming sectors of the economy.
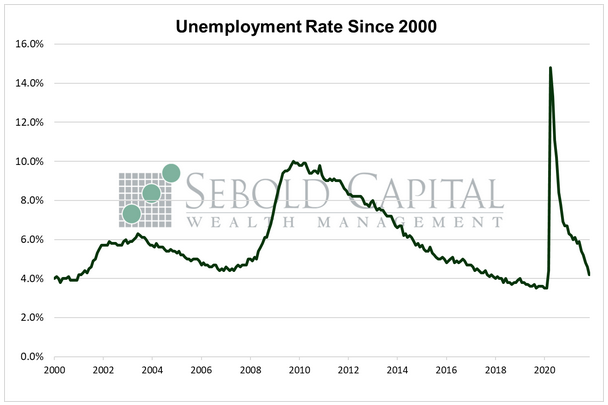
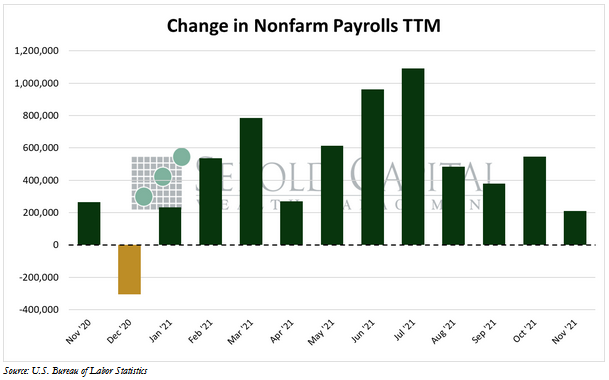
In November, U.S. employment rose by a mere 210,000, sharply missing market expectations of around half a million jobs and posting its smallest advance since December 2020. However, the headline unemployment rate saw a large decline from 4.6% to 4.2%—the lowest level since February 2020. The average workweek increased from 34.7 hours to 34.8. Average weekly earnings rose by $5.87 to $1,079.84, while hourly earnings increased by $0.08 to $31.03. The labor forced participation rate advanced for the first time in two months, from 61.6% to 61.8%. However, it remains below its pre-pandemic level of 63.3%.
Hiring seemingly slowed down last month, at least when measured on a seasonally adjusted basis. The latter is key when interpreting labor market data because it does not fully represent the number of people who were actually hired last month; the true number is 778,000, as shown by the data that is not seasonally adjusted. Normally, some adjustment is required in order to be able to accurately interpret employment data. There is a lot of seasonality in hiring; for instance, retailers tend to increase their workforce during the holidays to deal with the increase in traffic. However, Covid and the resulting lockdowns threw a wrench in the Labor Department’s seasonal adjustment and made it significantly less accurate. An alternative measure of employment, the ADP Payrolls Report, showed that 534,000 jobs were added in November, which is probably closer to what the government’s number should have been, if it had a more accurate seasonal adjustment. Chances are last month’s report will get upwardly revised anyway. September’s number was revised once again, this time from 312,000 to 379,000 (after being revised from 194,000), and October’s number was revised from 531,000 to 546,000. Let’s see what November’s report has to say in two months.
The transportation and warehousing sectors both posted solid gains last month, 50,000 and 90,000 respectively. Leisure and hospitality and manufacturing also ramped up hiring last month. However, these gains were partly offset by losses in retail. Labor force participation improved, with 594,000 people entering the labor force—the most since October 2020. That, coupled with a sizeable decline in the official unemployment level, helped drive the unemployment rate to its lowest level since the start of the pandemic, a level that could almost be considered full employment. However, the current labor force is still smaller than what it was back then, and the unemployment level is higher—although they are both slowly trending back to normal levels. Other labor market indicators suggest a stronger labor market than the Employment Situation report might suggest. Initial unemployment claims, a proxy for layoffs, are at historically low levels. Continued claims have seen a substantial decline, especially since September. Once the BLS is able to account for the distorted labor market the lockdowns created in their seasonal adjustment, we will likely get a clearer picture of the employment situation.
December 3, 2021