 Existing Home Sales provide the number of purchases made for homes, condominiums, and co-ops that have already been built, while New Home Sales represent the number of brand-new houses that were purchased or committed to being purchased over the course of a month. Both new and existing home sales give an indication of the demand for housing. When people purchase a home, they buy goods to fill their homes with, lifting other sectors simultaneously. New home sales are also more impactful to GDP than existing home sales since the entire sale value is included instead of only the real estate commission being included for an existing home during the sale. While home resales may not generate new construction jobs as housing starts do, they have a similar effect on consumer spending as people purchase items for their new home.
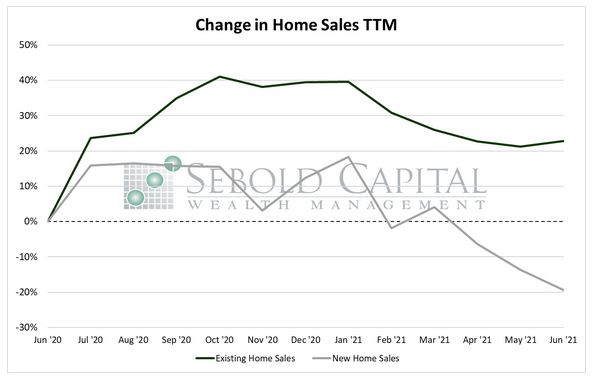
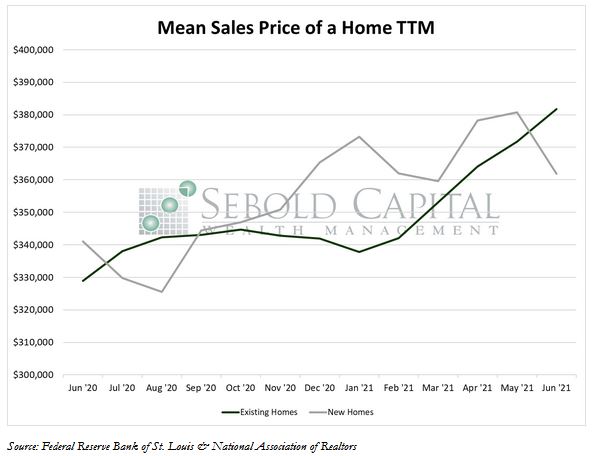
In June, sales of newly built homes declined by 6.6% to 676,000, while sales of existing homes rose by 1.38% to 5.8 million. Housing inventory increased for the fourth consecutive month, growing by 3.31% to 1.25 million. Construction activity picked up last month, with housing starts rising by 6.3% to 1.64 million. However, building permits declined by 5.3%, indicating that home building will likely slowdown in the near future. Sales prices for existing homes continued to advance, rising by 2.7% to an average of $381,800. However, prices for new homes declined by 5.0% to $361,800, the lowest level since March. Mortgage rates remained largely unchanged throughout the month, with the 30-year fixed rate hovering around 3.0% and the 15-year rate fluctuating between 2.2% and 2.3%.
New home sales largely slowed down last month. On a regional basis, sales of newly built homes declined in three out of the four major census regions. Sales plunged in the Northeast, where they fell by 27.9% from the previous month. Sales in the South declined by 7.8%, while sales in the West fell by 5.1%. The only region where new home sales rose was the Midwest, where sales advanced 5.7%.
On the other hand, existing home sales showed a slight improvement last month. They were rather consistent on a regional basis. Sales rose by 3.3% in both the Midwest and the Northeast. In the West region, sales advanced 1.0% while they remained virtually unchanged in the south.
The housing market continues to suffer from an imbalance between supply and demand, although it has lately shown some improvement. Housing supply has been held back due to soaring material costs, shortages, and a near halt in construction last year as a result of the pandemic. Housing demand had been fueled by record-low interest rates and a shift in consumer preferences as more people worked from home. Prices for existing homes have increased 16.1% from last year. New home prices had soared 20.1% on a year-over-year basis as of May, although with this latest release the figure eased to 6.1%. Demand for housing will likely decline if prices continue to rise as many consumers might find it challenging to afford a home, regardless of how low mortgage rates are. However, if demand declines, then prices will likely ease allowing the housing market to reach some semblance of equilibrium—especially once supply is able to catch up.
July 26, 2021