 The Consumer Price Index (CPI) shows us inflationary pressures in the economy. The CPI measures the average price levels of a basket of goods and services purchased by consumers. The index starts with a base time period (1982-1984, currently) and shows the overall increase since that time. As with many economic indicators, it can be volatile from month to month, with food and energy prices often leading the volatility.
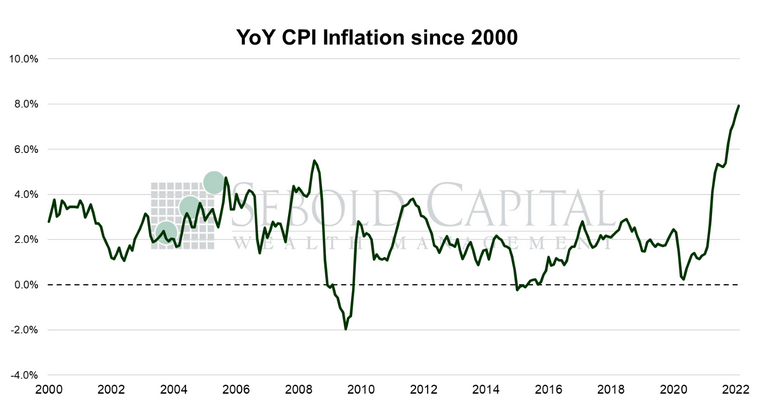
In February, the CPI rose by 0.8% to a level of 284.2, matching market expectations for the first time in months. Year-over-year consumer inflation soared to 7.9%, its highest level since January 1982. Core CPI—which excludes prices for food and energy and is therefore considered to be less volatile—rose by 0.5% to a level of 287.9, also in line with forecasts. Core inflation surged to 6.4%, also hitting yet another four-decade high.
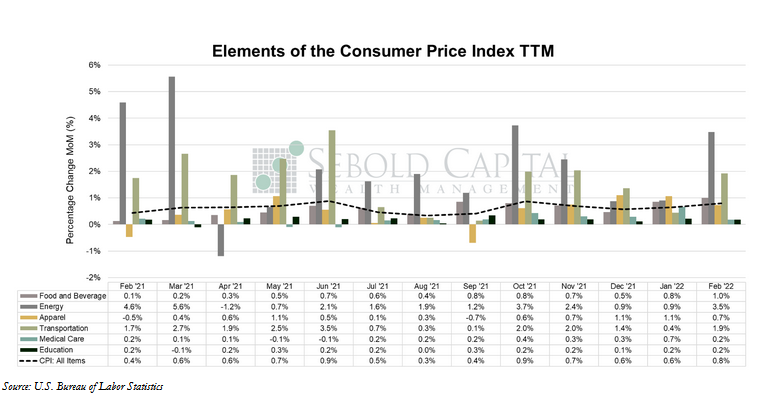
Consumer prices continued their relentless advance last month, as rising energy, food, and services costs pushed the headline inflation print to its highest value in over forty years. The usual suspects were among the biggest gainers in February—energy prices went up by 3.35% from the previous month, transportation costs rose by 1.9%, and food and beverage prices increased by 1.0%. Gasoline prices alone surged by 6.65% in one month, and that is before accounting for the parabolic increase in oil prices since the invasion in Ukraine began. In fact, February’s report does not reflect any of effects of the current geopolitical tensions, which are only expected to add to the existing price pressures. Owners’ equivalent rent also rose in February, posting its sixth consecutive monthly increase of 0.4%. On an annual basis, OER has risen by 4.3%, which is high compared to its historical levels but surprisingly muted when compared to the increase real home prices and rents.
The inflation print itself also does not fully reflect the severity of the situation. Sure, 7.9% seems very high, and it is; likewise, the increase from January’s 7.5% print to February’s is nothing to scoff at. But the month-over-month increase shows a more accurate picture of inflation. In December and January, prices rose by 0.6% on a monthly basis; last month they went up by 0.8%. Inflation is not moderating, it is accelerating. Annualizing the last three months of the CPI yields inflation of 8.3%, while core inflation would hit 6.8%. Again, that does not include the impact that the war in Ukraine will have in prices, particularly in the energy sector. The month-over-month increase is going to become even more important going forward as the year-over-year calculation is going to start using a higher base, potentially downplaying some of the price pressures.
To make matters worse, there is uncertainty once more surrounding the Fed’s plans to tighten monetary policy throughout the year. The first rate hike coming this month remains essentially a sure thing. However, the rippling effects of the Ukraine crisis could cause the Fed to reconsider how much they are willing to raise rates in the near term. There is a very real possibility of higher energy costs and other disruptions leading to an economic slowdown, in which case the Fed would be in a very tight spot for monetary policy decisions; tighten policy and risk amplifying the economic effects of the invasion or leave things where they are and continue to let inflation run unchecked. Either way, not a pretty picture. There are certainly headwinds ahead.