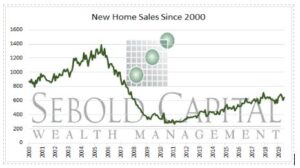
 New single-family home sales represent the number of brand-new houses that were purchased or committed to being purchased over the course of a month. Data pertaining new home sales is collected from the Selling Office Commission and local building permit offices assuming that new houses built are being built to sell. This indicator has a trickle-down effect as demand rises for durable goods and consumer spending increases, boosting GDP. It is also a sign of strength in the consumer balance sheet to make the investment.
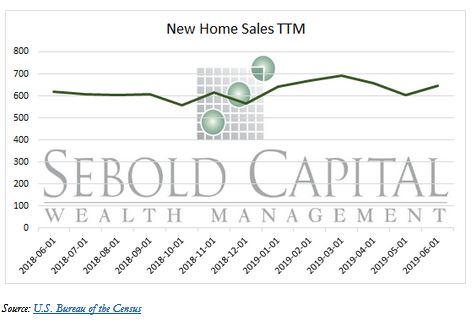
New home sales rose 7% in June to a 646,000 annualized rate, up from May’s rate of 604,000. Year-over-year, new home sales are up 4.53%, or 28,000 units from June of 2018.
The Northeast and Midwest census regions for new housing starts gained at 1.41% and 1.62% respectively in June; controversially, the South and West census regions lost 3.43% and 3.53% in June. The increase of money being spent in the Northeast and Midwest home buying sectors could indicate an increase of money spent in other sectors of the economy. When people buy new homes, they oftentimes buy a lot of goods to fill their home with, lifting other sectors simultaneously. New home sales are more impactful than existing home sales to GDP because the entire sale value is added, instead of only the value added to an existing home during sale. Contradicting the growth of housing starts in the Midwest and Northeast is the contraction of the South and West’s housing start market, showing potential for a contraction of other sectors in those regions.
July 30, 2019