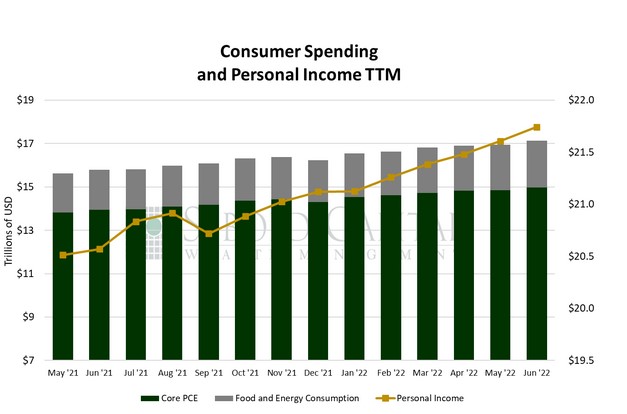
Consumer spending, measured by Personal Consumption Expenditures (PCE), makes up approximately two-thirds of the economy and is a direct measure of purchasing activity. PCE is a reliable indication of inflation because it is calculated from data acquired directly from the GDP report and businesses. It shows us where consumers are spending their dollars, whether it be durable and non-durable goods, or on services. Changes in the personal income level usually dictate consumer spending.
In June, personal consumption surged by 1.07% to $17.14 trillion, while personal income rose by 0.62% to $21.74 trillion. Excluding food and energy, consumption increased 0.85% to $14.98. Spending on durable goods rose 1.53% to $2.12 trillion, while spending on non-durable goods increased 1.68% to $3.81 trillion. Spending on services was 0.78% higher last month, coming in at $11.21 trillion.
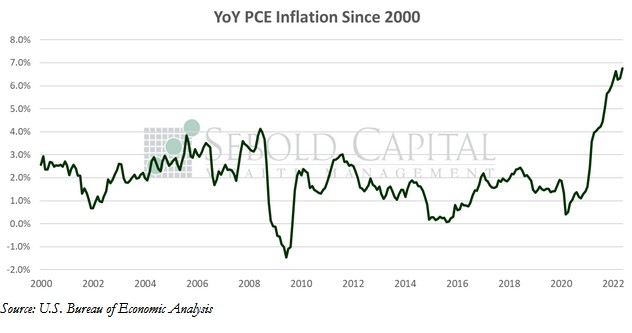
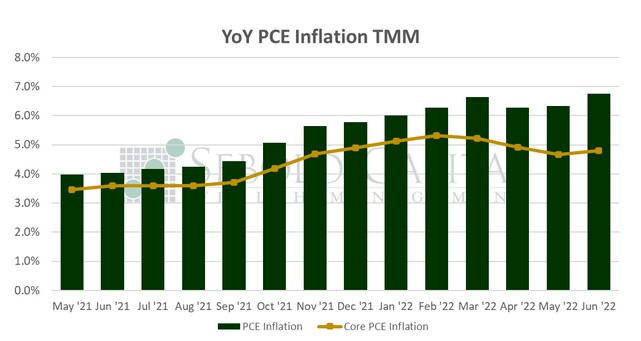
Consumer spending accelerated last month, largely fueled by soaring prices. The PCE price index saw its largest monthly increase in more than forty years—a whopping 1.0%—and rose by 6.8% on an annual basis. Of course, PCE inflation hitting its highest level since 1982 is hardly a surprise to anyone after the CPI print earlier this month. Energy prices were naturally responsible for a good portion of June’s worse-than-expected inflation; however, price pressures were broader than in previous months as well. Core prices rose 0.6% last month, doubling May’s increase of 0.3%. The annual rate of the Fed’s preferred inflation measurement increased from 4.7% to 4.8%, meaning that it is trending upwards again.
Spending growth in real terms has decelerated drastically. Consumers are being squeezed by higher prices, with their inflation-adjusted incomes being eroded month after month despite some significant wage gains. Despite incomes rising by 0.6% last month, workers ended up taking a 0.3% pay cut in real terms. Even the significant savings that consumers built up during the pandemic are starting to evaporate. Personal savings declined to their lowest level since 2016 and the savings rate is at levels consistent with the 2008-2009 recession. This is very relevant given the most recent GDP print, which showed a 0.9% contraction. Consumer spending—the largest component of GDP by far—still managed to increase according to the latest advance estimate, but the annualized rate declined from 1.8% to 1.0%. With falling real incomes and dwindling savings, it is unclear how much longer consumers will be able to bear higher prices, and how much longer they will be able to continue driving whatever economic activity is left.