 The Producer Price Index (PPI) looks at the average change in selling prices from the viewpoint of domestic producers of both goods and services. Three areas of production are observed: industry-based, commodity-based, and commodity-based final demand-intermediate demand. Investors look to the producer price index, which is a more relevant way of gauging inflation than the CPI because of the large basket of producers (100,000 price points) that Bureau of Labor Statistics uses as a data pool for their calculations.
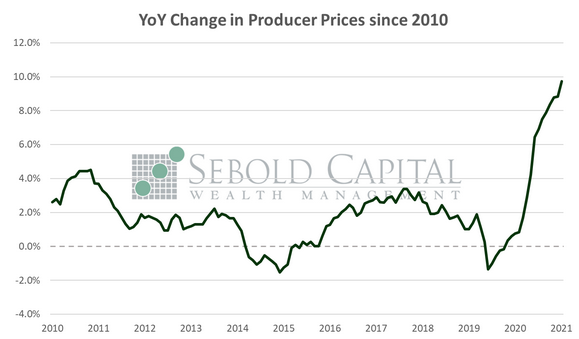
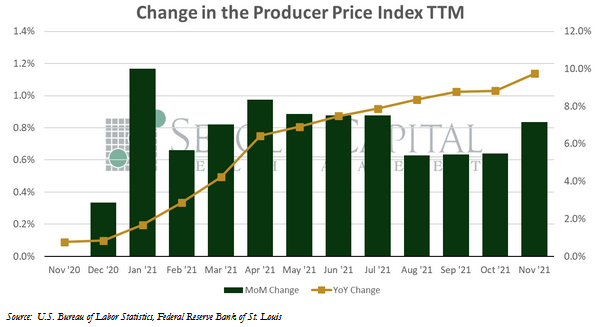
In November, the PPI rose by 0.8% to a level of 131.0, beating market expectations of a 0.5% increase. Core PPI, which excludes prices for food and energy (and is therefore considered to be less volatile), increased by 0.7% to a level of 128.9. Year-over-year producer inflation surged to 9.7%, while core producer prices have increased by 7.8%.
Prices paid by producers rose once again at a record pace last month, continuing the ongoing trend. The cost of goods increased 1.2% last month, while prices for services advanced by 0.7%. The latter is particularly noteworthy because prices for the services sector increased by a mere 0.2% in October. The faster increase last month may signal that the cost of services may be catching up after initially lagging once the economy reopened, meaning double-digit PPI inflation is likely in the horizon. Food and beverage prices increased by 1.2%, while energy costs advanced 2.6% despite lower crude oil prices. Commodity prices rose by 1.4% last month, while soaring by 22.8% on the year. The most notable gainers among commodities were iron and steel scrap, with prices increasing by 10.7% from the previous month.
December 14, 2021