 The Producer Price Index (PPI) looks at the average change in selling prices from the viewpoint of domestic producers of both goods and services. Three areas of production are observed: industry-based, commodity-based, and commodity-based final demand-intermediate demand. Investors look to the producer price index, which is a more relevant way of gauging inflation than the CPI because of the large basket of producers (100,000 price points) that Bureau of Labor Statistics uses as a data pool for their calculations.
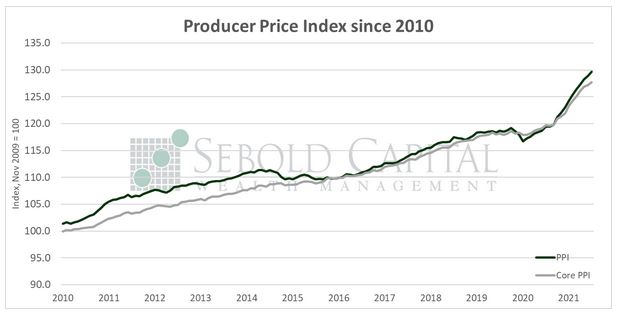
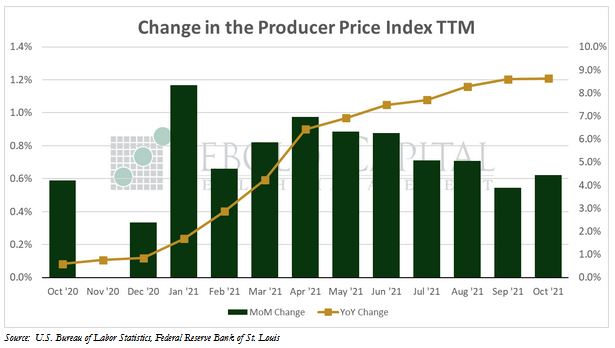
In October, the PPI rose by 0.6% to a level of 129.7, matching market expectations. Core PPI, which excludes prices for food and energy (and is therefore considered to be less volatile), increased by 0.4% to a level of 127.7. Year-over-year producer inflation remained at 8.6% last month, while core producer prices have surged by 6.7%. If this year’s data is annualized, producer inflation is on track to hit 9.6% for 2021, while core inflation would hit 7.7% under that same assumption.
Prices paid by producers continued to climb last month. Energy prices soared by 4.8%, leading the advance in the index, while food prices eased by 0.1% after two consecutive months of gains. Prices for goods rose by 1.2%, while prices for services saw a more moderate 0.2% increase. Light motor trucks, which have been one of the main drivers of price indices this year, saw a slight decline last month. However, on the services side, the main driver were prices for autos and auto parts, which rose by 8.9%. As wholesale prices keep rising, businesses will have little choice but to pass on those costs to their consumers. Given the extent to which producer prices have already increased, we are likely going to see continued price pressures on both the consumer and producer sides well into next year—and quite possibly beyond that.
November 9, 2021