 Gross Domestic Product (GDP) is the broadest measure of economic activity within a country and measures the market value of all final goods and services produced within a country over a certain period. There are four components GDP is created from: investment (including residential and nonresidential expenditures), consumption (including durable goods, nondurable goods, and services spending), government spending, and net exports (a country’s total exports minus its total imports).
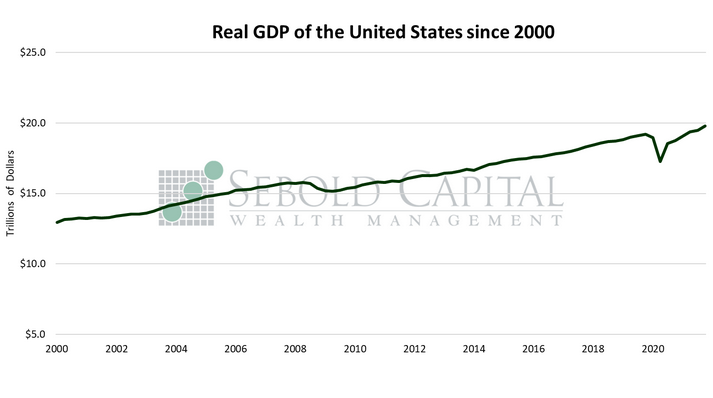
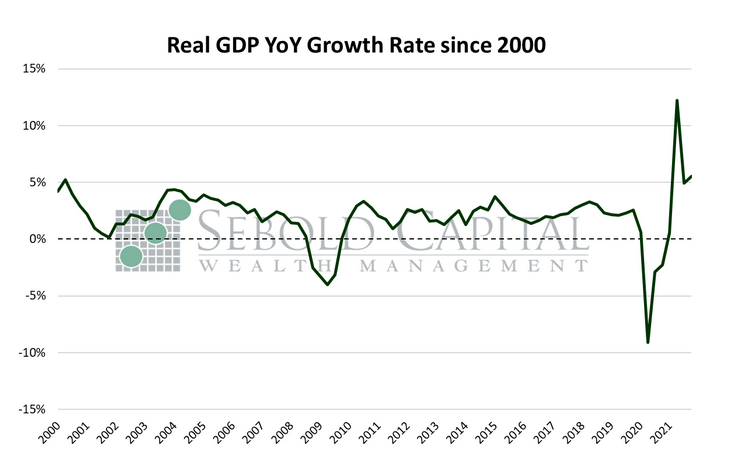
According to the Bureau of Economic Analysis’ first advance estimate for Q4, real GDP grew at a rate of 1.7% from the previous quarter and at a rate of 5.5% in 2021. The headline rate, which is the quarter-over-quarter growth rate annualized, came in at 6.9%—above market expectations. Consumption, investment, and government expenditures all rose, while net exports declined as the trade deficit continued to widen.
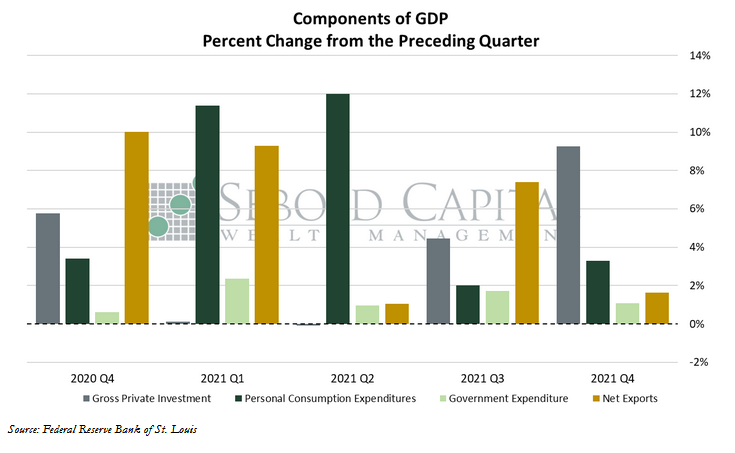
Personal consumption expenditures, which make up the largest share of GDP, increased 0.8% from the previous quarter to a total of $13.8 trillion after adjusting for inflation. That led to an annualized growth rate of 3.3%, up from 2.0% last quarter. However, much of that spending was done early in the quarter, and most of it was due to companies restocking their dwindling inventories—as opposed to consumers and firms buying goods and services for regular consumption. Excluding these inventory effects, output grew at a much more modest 1.9% annual rate in Q4. Durable goods and retail spending declined in December, which may lead to the first estimate being downwardly revised for its next release.
Spending by firms saw a large increase last quarter, with Gross Private Domestic Investment growing by 7.2% in real terms from Q3. Nonresidential fixed investment increased by 0.5% in Q4, however, residential fixed investment declined by 0.2%. Government expenditures rose by 1.1% last quarter. Net exports declined by 1.6% to a total of -$962.6 billion. Exports of goods and services rose by 7.2% to $2.66 trillion, while imports increased by 5.6% to $3.63 trillion. The monthly trade deficit surpassed $100 billion for the first time in December, up from $98 billion in November. The decline in net exports subtracted 1.39 percentage points from Real GDP growth.
The GDP deflator increased by 1.7% in the fourth quarter, the largest quarterly increase in prices for the overall economy since 1981. The increase yielded an annualized rate of 7.0%, up from 5.9% in Q3, also the largest increase since 1981. However, the year-over-year increase in prices—at least according to the BEA—was 5.9%. While that inflation rate is certainly above historical trends, it pales in comparison to some other measures of inflation, many of which showed prices increasing by double-digits. Even the CPI, which has arguably failed to capture the true extent of consumer-price inflation, increased by 7.1% in 2021 on a year-over-year basis. Using a more honest deflator would yield a much lower rate of GDP growth in real terms—and some would yield a contraction. Rising prices will likely continue to increase, weighing on economic growth. Growth is already expected to moderate in 2022, meaning that price pressures may lead to little or no economic growth in real terms for this year.
January 27, 2022