
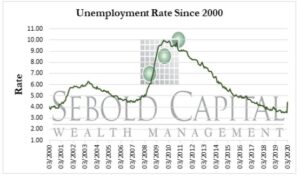
 The US Unemployment Rate measures the percentage of total employees in the United States that are a part of the labor force but are without a job. It is one of the most widely followed indicators of the health of the US labor market and economy. Historically, the US Unemployment Rate reached as high as 10.80% in 1982 and 9.9% in November of 2009. Both times were notable recessionary periods.
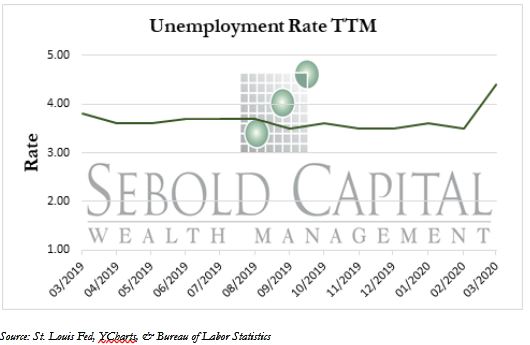
The current U.S. unemployment rate is at 4.04%, the highest it has been since April 2017. The current rate is a 25.7% increase from February’s rate of 3.5% and a 15.8% increase from the rate of March 2019. However, this rate is still lower than the long-term average of 5.73%.
The U.S. cut 701,000 jobs during March due to the coronavirus outbreak. The pandemic has forced businesses to shut down by government order to prevent the virus from spreading, resulting in entire industries being placed on a standstill. The greatest drop in employment was reported in the leisure and hospitality industry, which lost nearly 460,000 jobs in March. These losses primarily came from restaurants and bars that were forcibly closed by the newly imposed health restrictions as a result of the pandemic. Other industries that saw large losses included the healthcare, professional & business services, and retail trade, which each respectively, lost 76,000, 52,000, and 46,000 jobs. Considering the pandemic was declared during the final two weeks of March, it can easily be predicted that the unemployment rate will continue to spike in April as layoffs continue due to the extension of social-distancing measures to April 30th.
April 3, 2020